Our Soil

Do-it-together screening for soil pollution

Page 7 of 10

Dan Departs Tucson and the Ramírez-Andreotta Lab for RPI

Dan left the Ramírez-Andreotta laboratory on January 22 to return to the northeast in preparation for the next stage of the project: collaborative workshops with Troy residents using the Community Soil Study Toolkit in order to identify and address any arsenic, copper, and lead that may be found.

But not before completing the necessary laboratory work to support the Community Soil Study Toolkit and one moonless night in December at the Chiricahua National Monument:

Dan Visited the ALEC Lab and their ICP-MS

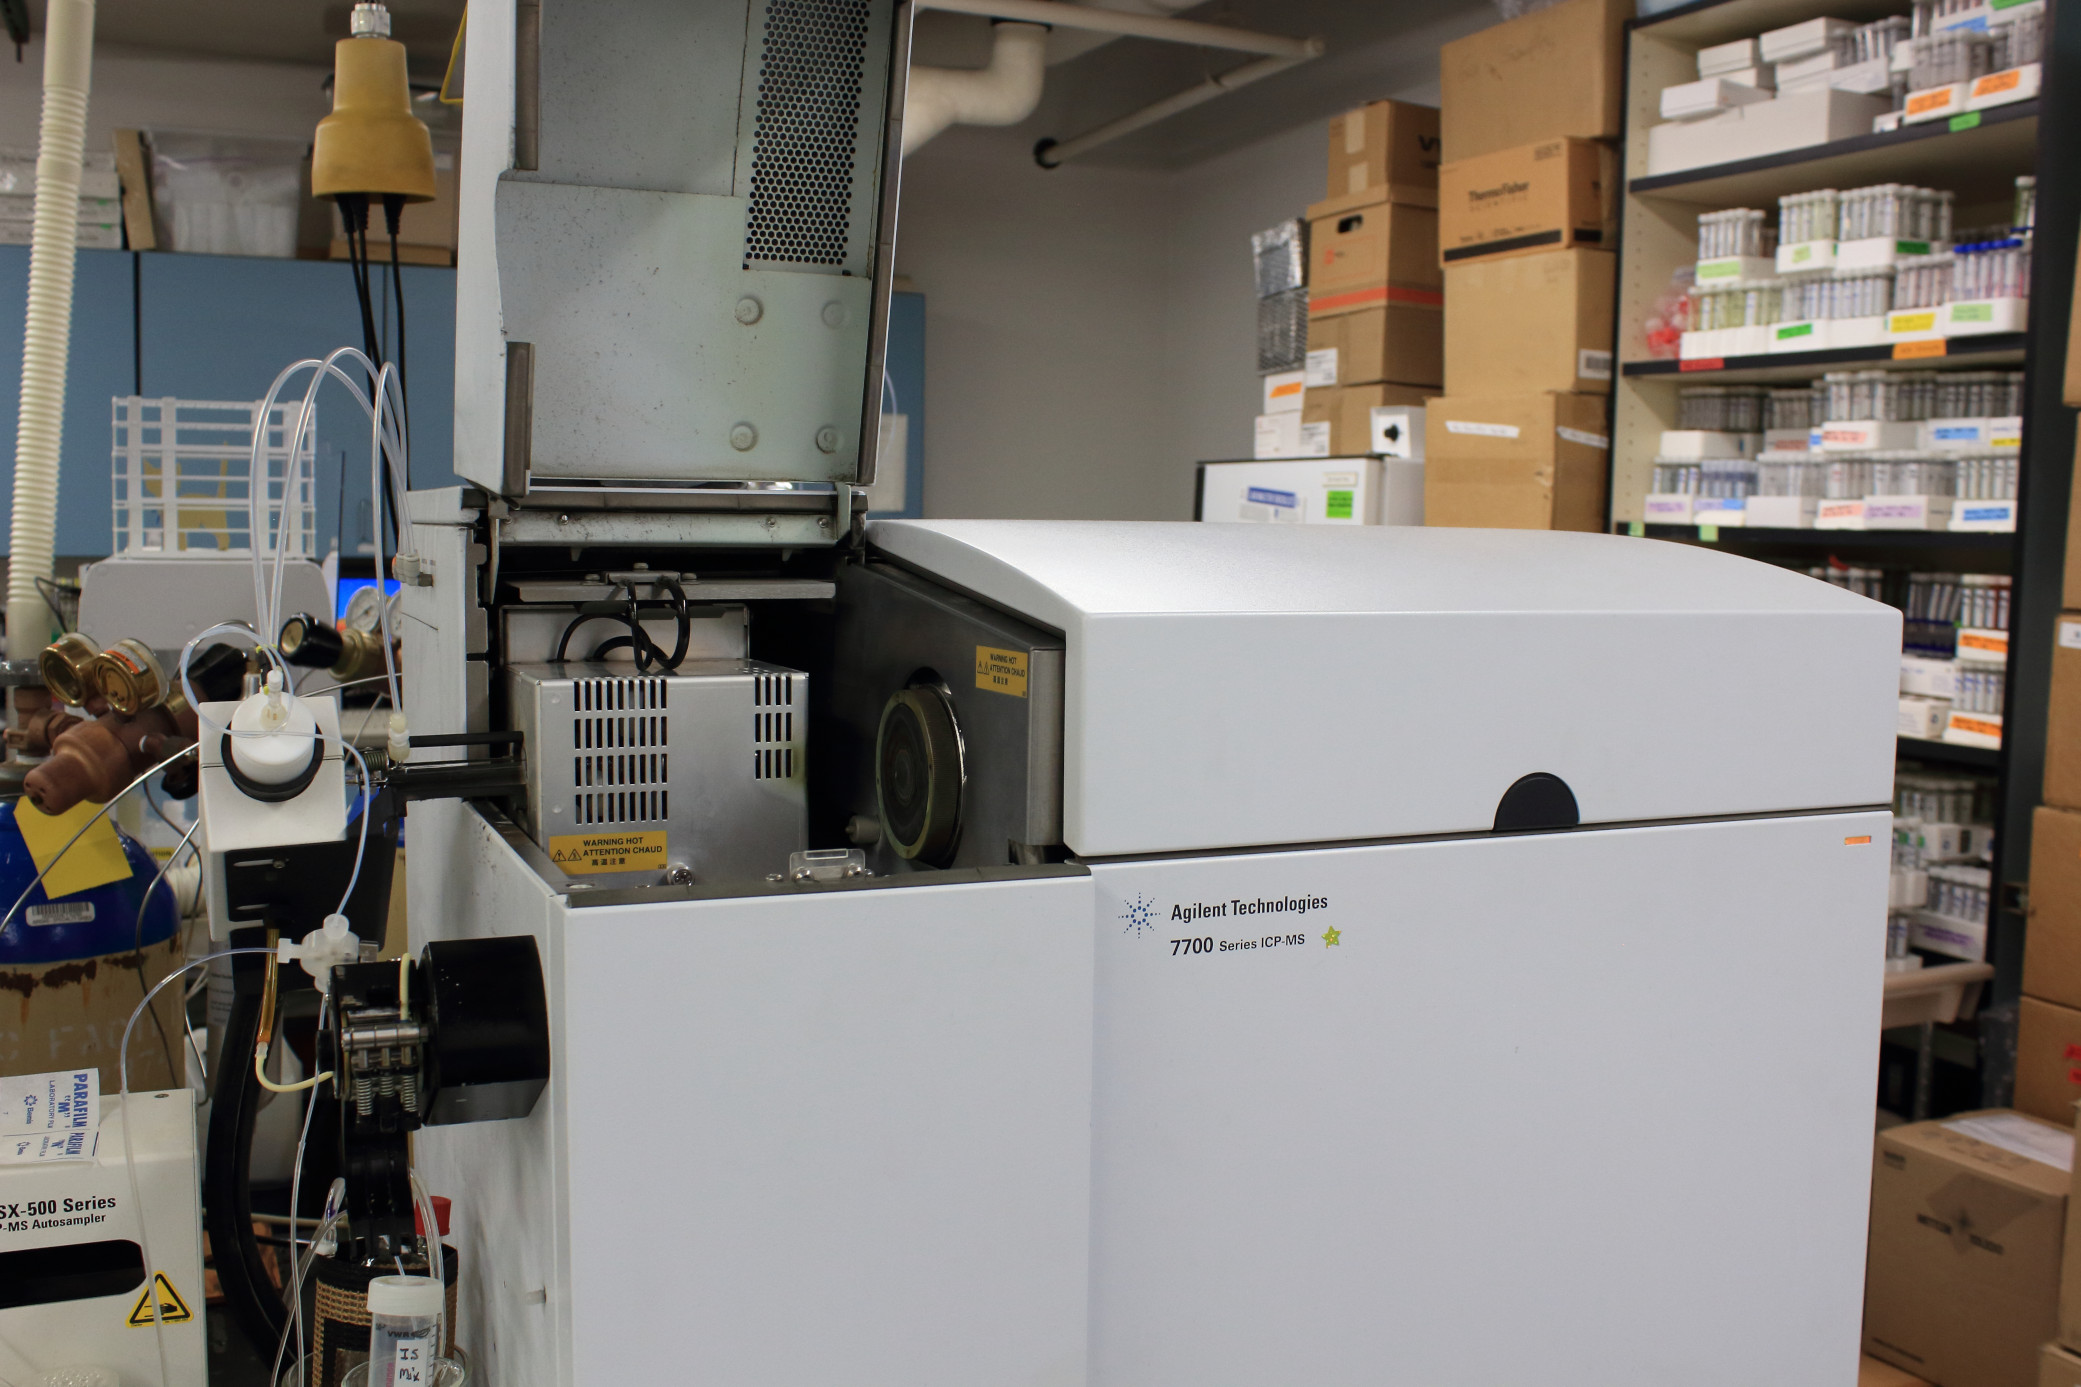
Today Dan visited the Arizona Laboratory for Emerging Contaminants (ALEC) at the University of Arizona where the Troy soil samples prepared in the Ramírez-Andreotta laboratory were sent for analysis using their inductively coupled plasma mass spectrometer (ICP-MS). The director of ALEC, Mary Kay Amistadi, walked Dan through the process of how the Troy soil samples were prepared and analyzed with the ICP-MS to measure the amount of arsenic, copper, and lead in the samples. A small quantity of soil (1 gram) is added to an acidic solution and placed in an industrial microwave to bring all of the metals in the soil into the solution. Then a pump moves the solution into the ICP-MS where it is vaporized and all of the components are measured by their atomic mass.

These laboratory measurements will be used to calibrate the arsenic, copper, and lead field tests of the Community Soil Study Toolkit. By calibrating the tests in the Toolkit, we can use the color responses that they produce to determine the quantities of arsenic, copper, and lead in a soil sample. The preparation of the soils for analysis with the ICP-MS is similar to the preparation in the field tests in the Community Soil Study Toolkit, with a few substitutions: (1) there is no industrial microwave in the field, so the soil is soaked in an acidic solution at room temperature for a longer period of time; and (2) there is no ICP-MS in the field, so a way of generating a color response that corresponds to the amount of arsenic, copper, and lead is substituted.

Below is a picture of the ICP-MS at ALEC:
Dan Measuring Soil Texture of Troy Soils

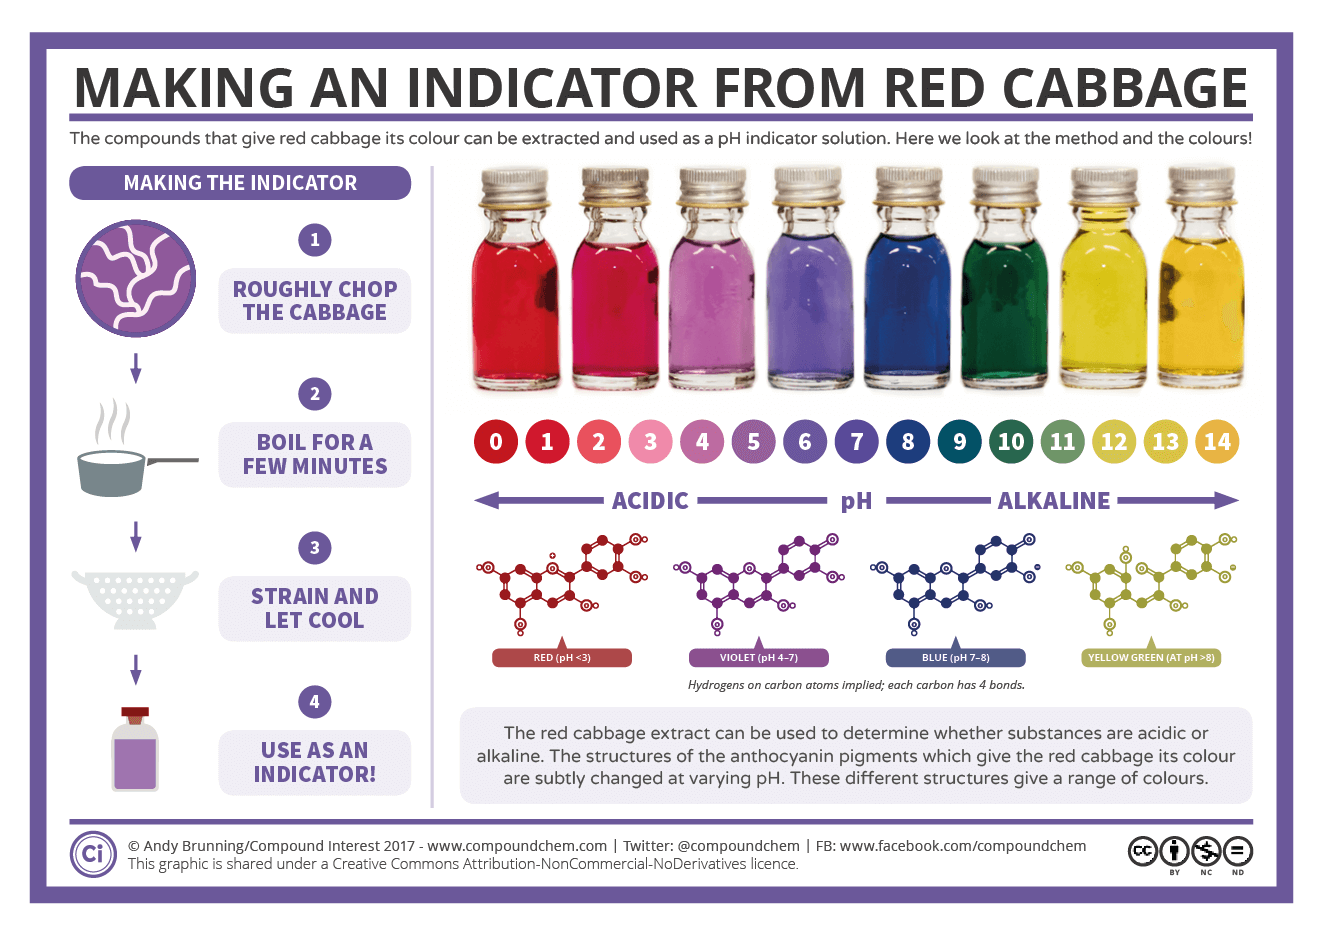
Today, Dan started a set of experiments to determine the soil texture (percentage of sand, silt, and clay) of the Troy soil samples. Sand, silt, and clay are the main nonliving solid components of soils. The primary difference between sand, silt, and clay particles is their size. The Soil Science Society of America created the graphic below to demonstrate the relative size of sand (largest), silt (middle), and clay (smallest) particles:

Soil texture is a common way to classify soils. It is also relevant for human health if the soil contains lead or other metals. Smaller particles are more likely to stick to our hands when we touch soil, and they are also more likely to be kicked up as dust in the air.

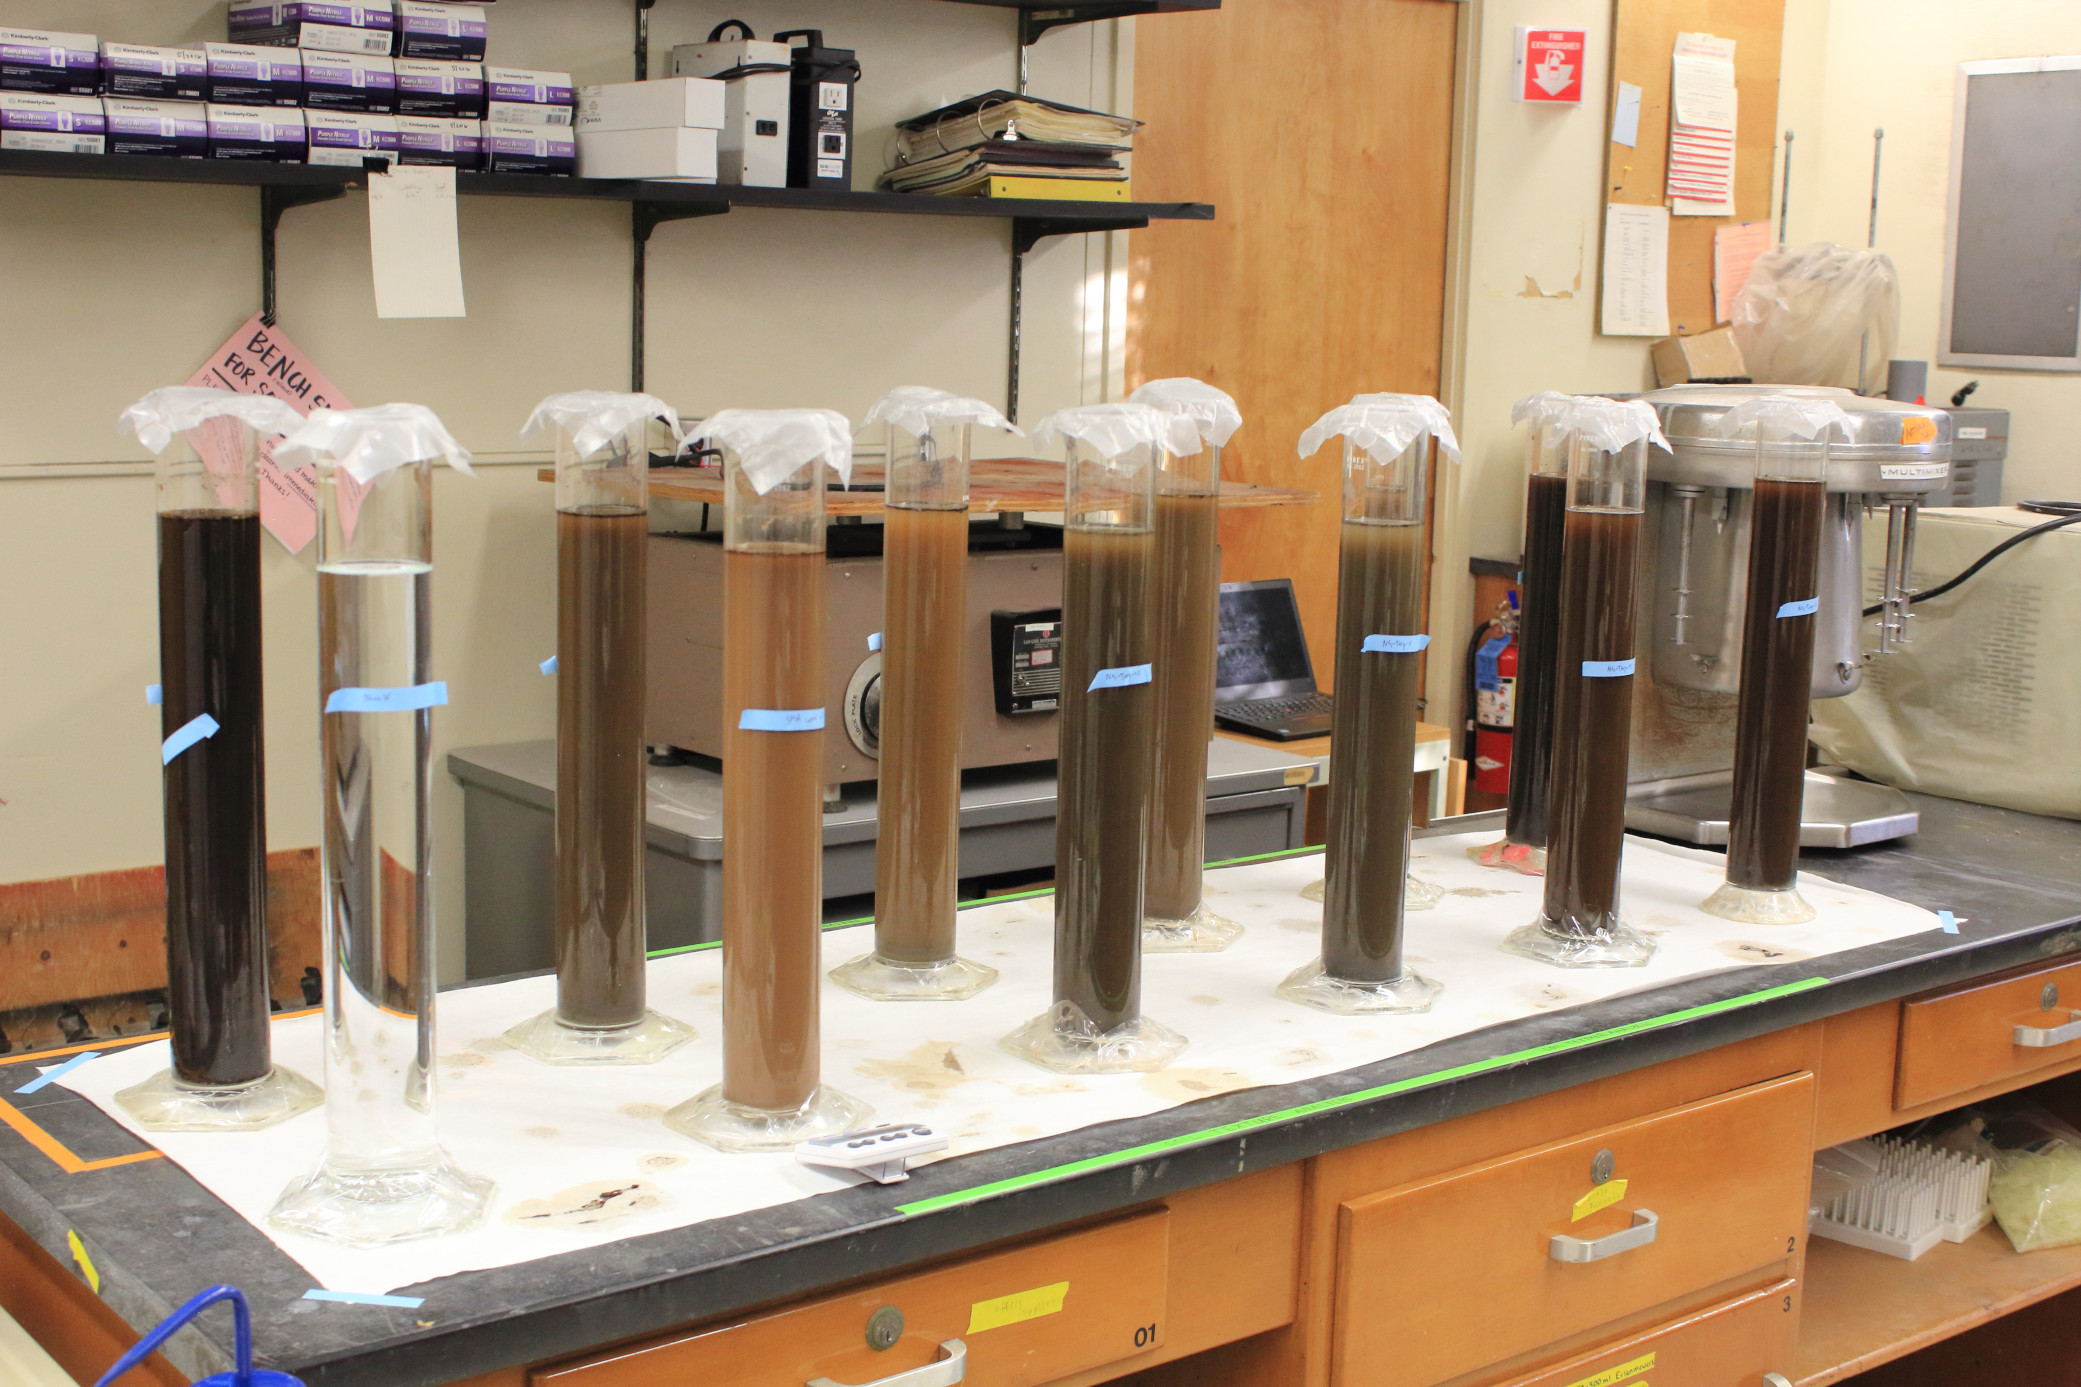
One way to measure soil texture is with a sedimentation experiment. Individual soil particles settle in water at different speeds based on their size. By mixing a soil sample in a column of water and then measuring how it settles over time, the particle sizes in the soil can be calculated. Below is a picture of the sedimentation columns from one set of experiments with the Troy soils:

Another way to measure soil texture is by feel. The USDA created a flow chart so that texture could be determined through a series of steps where soils are rubbed between your fingers. The flow chart can be found here.

Dan Trialing Copper Test for Community Soil Study Toolkit

Dan is continuing to work on the Community Soil Study Toolkit in the Ramírez-Andreotta laboratory with the field test for measuring copper in soil. This test is based on a method developed by our collaborators on the Nuestros Suelos project in Chile. Dan has completed measurements for the soil samples used with the soil lead and arsenic field tests performed earlier in the month: samples from public spaces in and around Troy, NY, and several samples archived in the Ramírez-Andreotta laboratory. He is now in the process of organizing and comparing the field results with the laboratory methods used to measure copper in soils. By comparing the field and laboratory results, a color scale can be established so that the color response can be quantified as the amount of copper in the soil.

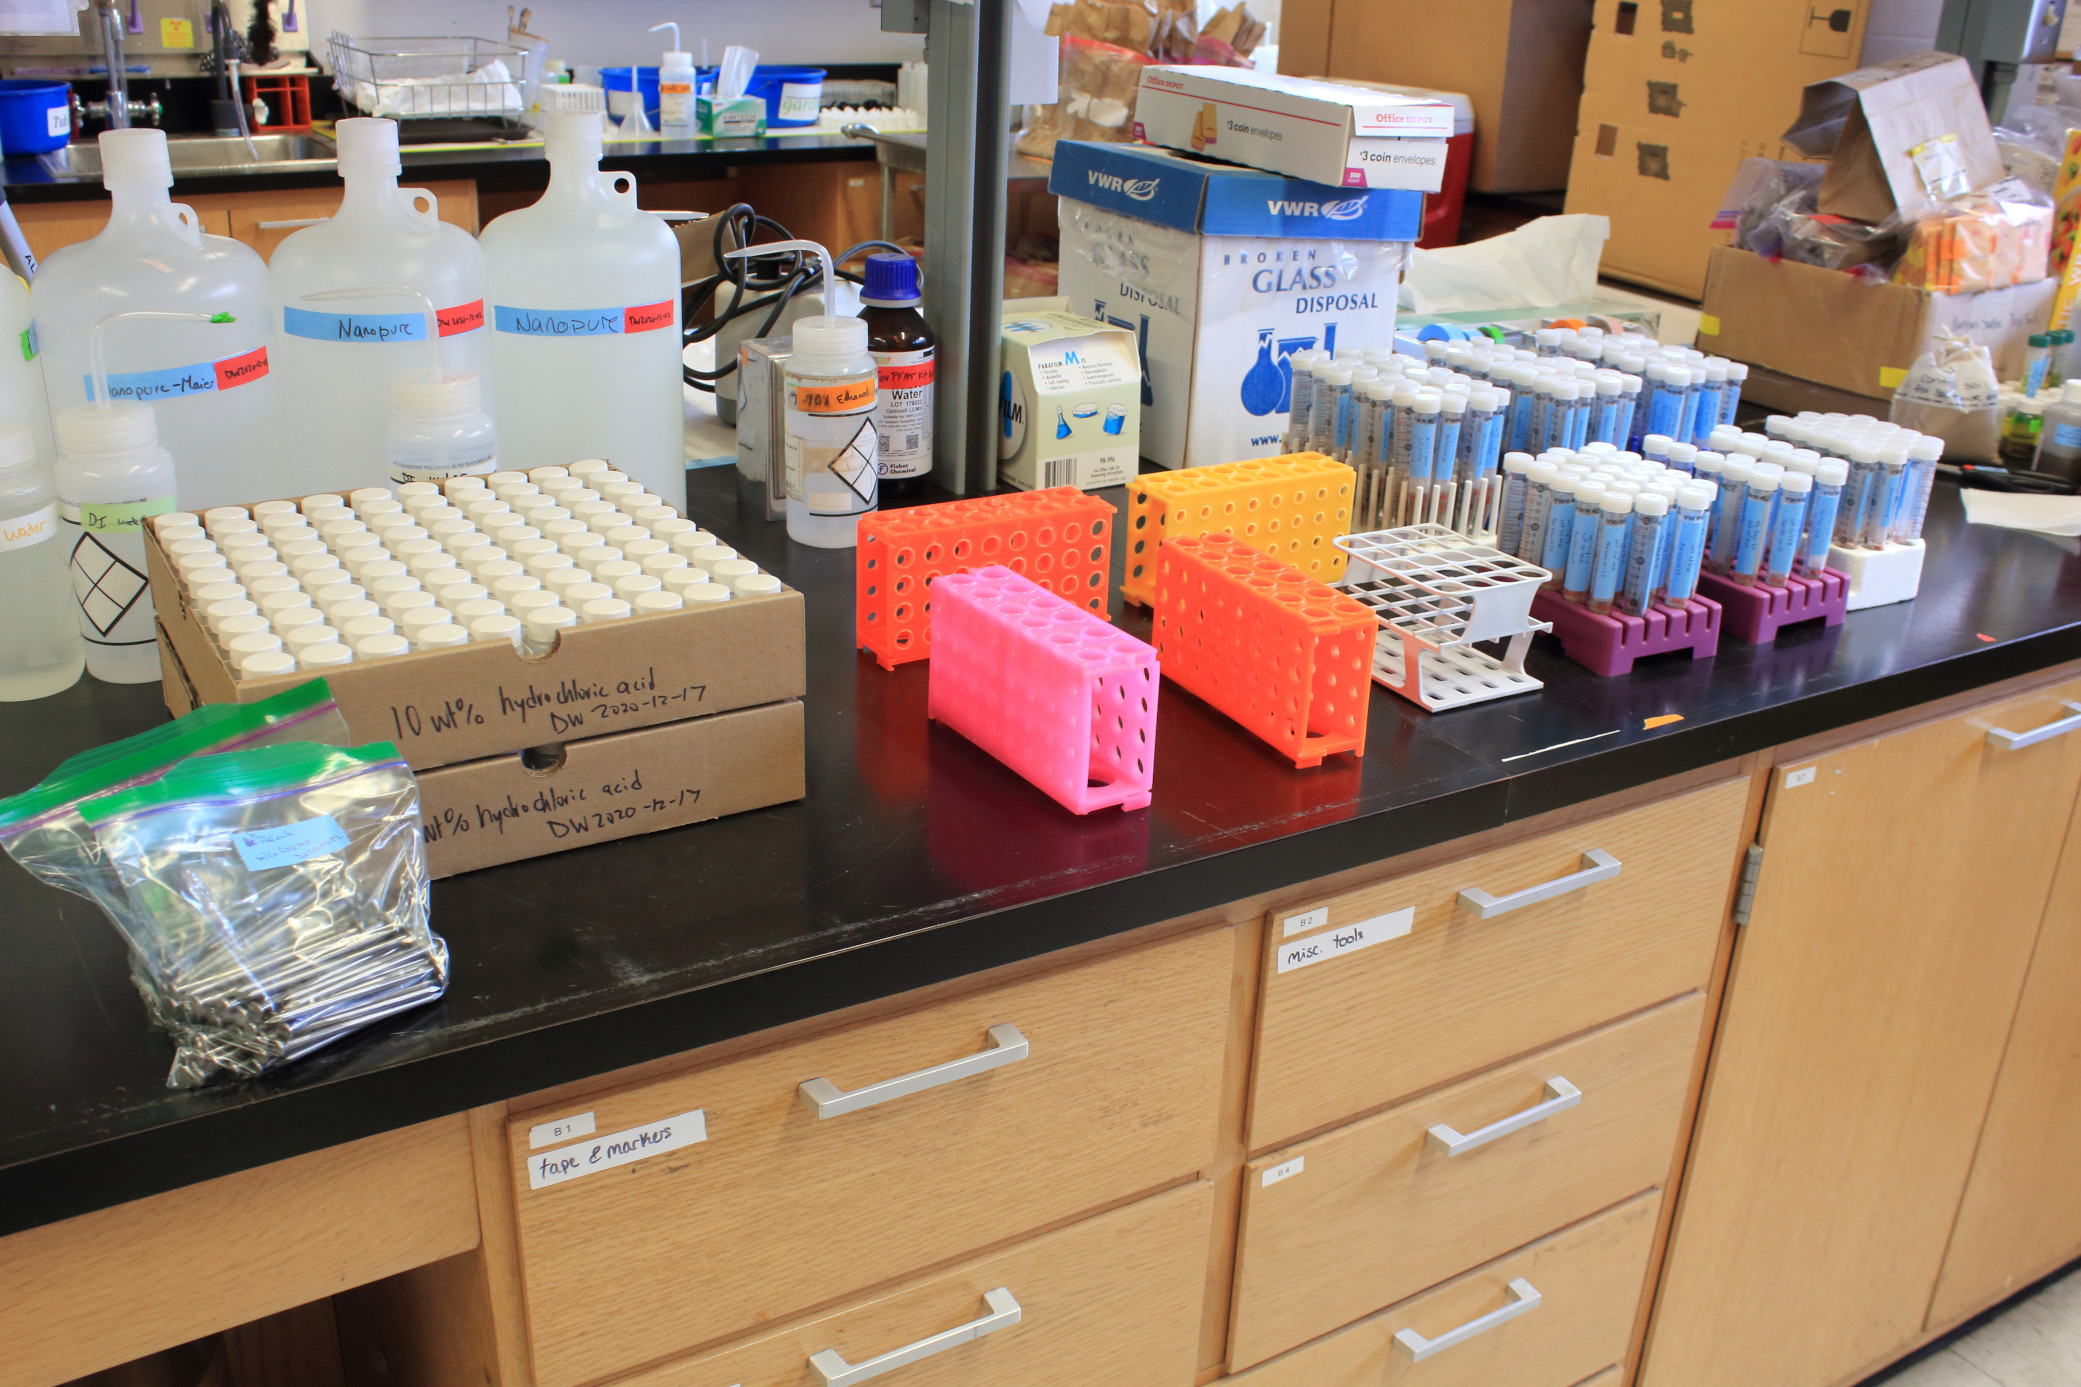
The picture below shows Dan’s setup in the laboratory for conducting the copper field test: (1) soil samples are first added to vials and mixed with acidic solutions to extract copper from the soils; (2) after thirty minutes of the soil soaking in the acidic solution, a filed nail is added to the vial; (3) copper ions in solution undergo an electrochemical reduction-oxidation reaction and deposit on the nail; and (4) the intensity of the copper color on the nail corresponds to the amount of copper present in the soil.

Dan Trialing Arsenic Test for Community Soil Study Toolkit

Dan is continuing to work on the Community Soil Study Toolkit in the Ramírez-Andreotta laboratory, now looking at a field test for measuring arsenic in soil. This test is based on a method under development in the Ramírez-Andreotta laboratory. He has completed measurements for the soil samples used with the soil lead field test earlier in the month: samples from public spaces in and around Troy, NY, and several samples archived in the Ramírez-Andreotta laboratory. He is now in the process of organizing and comparing the field results with the laboratory methods used to measure arsenic in soils.

The picture below shows Dan’s setup in the laboratory for conducting the arsenic field test:

Dan Trialing Lead Test for Community Soil Study Toolkit

Dan is working in the Ramírez-Andreotta laboratory with the field test for measuring lead in soil reported by Landes et al (2019) [open access article here]. He has completed measurements for the soil samples from public spaces in and around Troy, NY, as well as several soil samples archived in the Ramírez-Andreotta laboratory. He is now in the process of organizing and reviewing the resultant data to compare with the laboratory analyses of the soils in order to confirm that our use of the field kit compares favorably to the findings reported by Landes et al.

The picture below shows Dan’s setup in the laboratory for conducting the field test: (1) soil samples are first added to vials and mixed with acidic solutions to extract lead from the soils; (2) after an hour of the soil soaking in the acidic solution, a syringe and a filter is used to transfer just the solution to a second vial; (3) a gelatin capsule containing sodium rhodizonate is added to the solution in the second vial; (4) sodium rhodizonate turns purple in the presence of lead, with more lead leading to a more intense purple; and (5) the intensity of the color response reveals the amount of lead present in the soil.

« Older posts Newer posts »

© 2024 Our Soil

Theme by Anders NorenUp ↑